
Project information
- Platform: Google
- PL: R
- Libraries: dplyr, ggplot2, leaflet, gridExtra, lubridate, geosphere
- Skills: Data Cleaning, EDA, Data Viz
- Project date: 2024
- Project URL: Kaggle
Overveiw
This project is the Case Study for the Google Data Analytics Proffesional Certificate.
The aim of this project is to analyze bike-share data to uncover insights and trends that can help the Cyclistics bike-share company optimize its services and improve customer satisfaction. The analysis focuses on understanding user behavior, identifying key usage patterns, and providing data-driven recommendations for strategic decision-making.
Methodology
For this project, I followed a comprehensive six-step data analysis process: Ask, Prepare, Process, Analyze, Share, and Act.
- Ask: In this phase, the primary objective was to help the company understand the differences between annual users and casual members. By analyzing user behavior and identifying key usage patterns, we aimed to provide insights that would assist the marketing team in creating a campaign to convert casual users into annual members.
- Prepare: This phase involved detailing the various data sources used in the analysis. We meticulously gathered data from multiple sources, ensuring that each was relevant to the business task. This included transactional data, user demographics, and engagement metrics, among others.
- Process: In the processing phase, we documented the steps taken to clean and manipulate the data. This involved removing duplicates, handling missing values, and transforming data formats to ensure accuracy and relevance for subsequent analysis. The aim was to create a robust and reliable dataset.
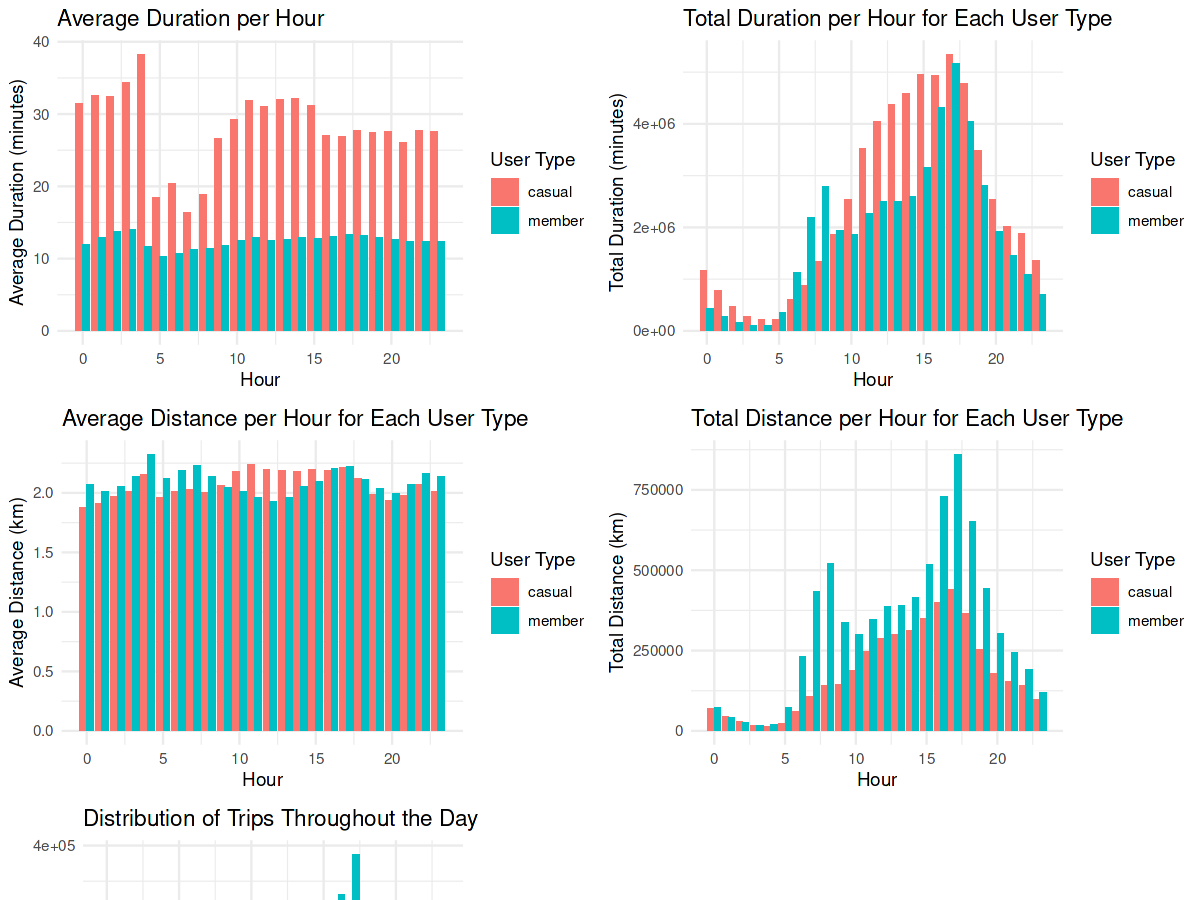
- Analyze: During the analysis phase, we conducted both descriptive and comparative analysis. This included generating supporting visualizations such as charts and graphs to aid in understanding the data. Key findings derived from the analysis highlighted significant differences in user behavior and usage patterns between annual users and casual members.
- Share: The sharing phase focused on effectively communicating the findings. We created comprehensive reports and presentations that included visualizations and key insights. This ensured that the stakeholders could easily understand the results and their implications.
- Act: Finally, we provided actionable recommendations based on the analysis. The top three recommendations included strategies to enhance user engagement, targeted marketing efforts to convert casual users to annual members, and suggestions for improving user experience. These insights aimed to directly address the business task and drive strategic decision-making.